
CBR Test Calculation: From Load-Penetration Curve to CBR Value
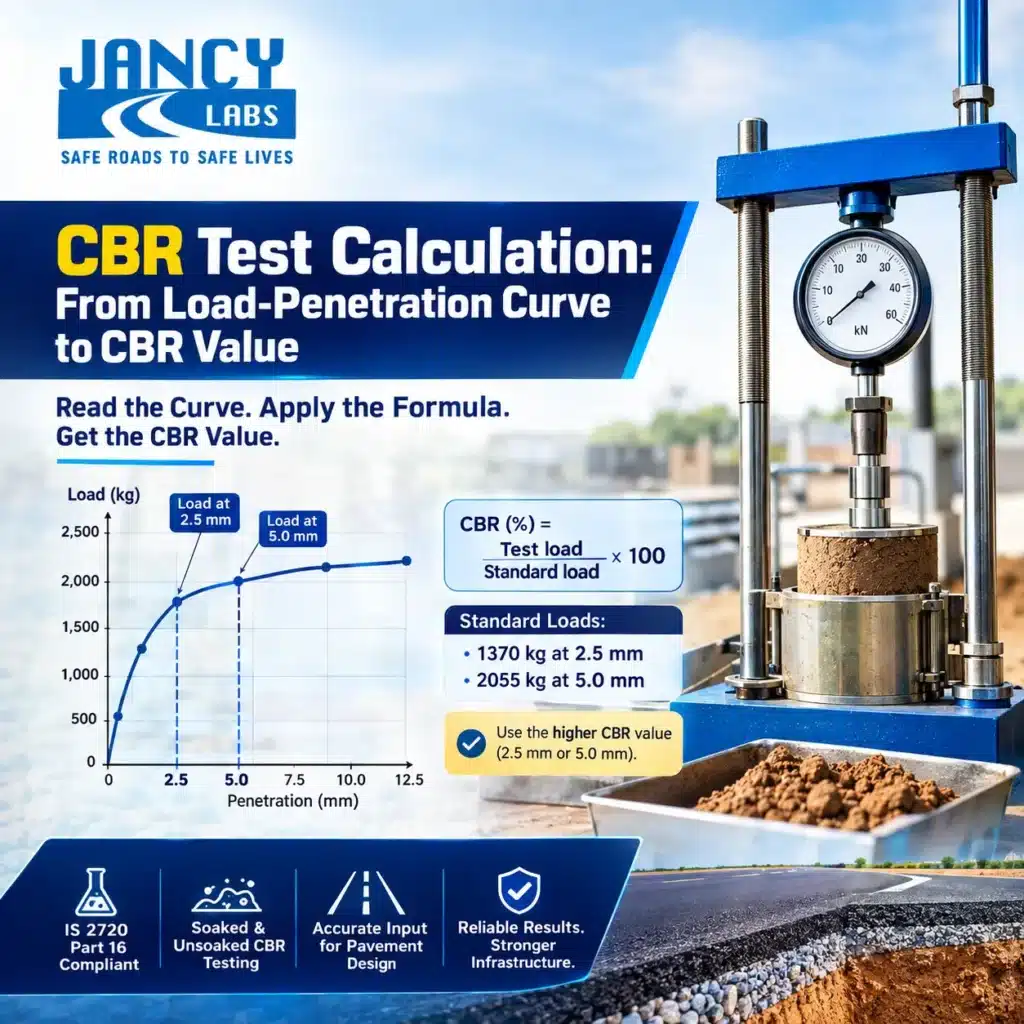
The cbr test calculation is where a soaked soil specimen and a proving-ring dial turn into a single number that sizes your entire pavement. Run the test perfectly and misread the curve, and you can specify a road that is either dangerously thin or wastefully thick. This guide walks through the cbr test calculation step by step: reading the load-penetration curve, correcting it, applying the formula, and turning the result into a pavement design input.
Key takeaways
- CBR compares your soil’s penetration resistance against a standard crushed-stone value.
- The cbr test calculation is done at 2.5 mm and 5.0 mm penetration; the higher of the two is normally taken.
- CBR (%) = (test load ÷ standard load) × 100, using 1370 kg at 2.5 mm and 2055 kg at 5.0 mm.
- A concave-upward start to the curve needs a correction before you read it.
- The CBR value feeds directly into IRC 37 pavement thickness design.
What the CBR value represents
The California Bearing Ratio expresses the strength of a subgrade as a percentage of the strength of a standard crushed-stone reference material. A CBR of 10% means the soil offers one-tenth of the resistance that high-quality crushed stone would at the same penetration. The full method is specified by the Bureau of Indian Standards in IS 2720 Part 16, and the soaked test is the one that matters for design because it models the soil at its weakest, after monsoon saturation.
If you need the test performed under accreditation, our CBR test laboratory runs both soaked and unsoaked CBR to IS 2720 Part 16. This article focuses on the calculation itself.
The load-penetration curve
Every cbr test calculation begins with this curve. A plunger is driven into the soil at 1.25 mm/min and the load is recorded at fixed penetration intervals: 0.5, 1.0, 1.5, 2.0, 2.5, 4.0, 5.0, 7.5, 10.0 and 12.5 mm. Plotting load (y-axis) against penetration (x-axis) gives the load-penetration curve — the raw material for every reading that follows.
A correctly conducted test gives a curve that is convex upward from the origin. Sometimes the initial portion is concave — an artefact of a soft top surface or plunger seating. That curve must be corrected before any value is read from it.
Correcting the curve
When the initial part of the curve is concave upward, apply the standard correction:
- Find the steepest straight portion of the curve’s initial section.
- Extend that straight line downward until it meets the penetration axis.
- The point where it cuts the axis becomes the new, corrected origin.
- Shift all penetration readings so they are measured from this corrected zero.
Skip this step on a concave curve and every load you read will correspond to the wrong penetration — inflating or deflating the CBR.
The CBR formula and calculation
With a corrected curve, read the loads at 2.5 mm and 5.0 mm penetration and apply the cbr test calculation:
CBR (%) = (Test load ÷ Standard load) × 100
The standard loads are 1370 kg (13.44 kN) at 2.5 mm and 2055 kg (20.15 kN) at 5.0 mm. So if your soil carries 137 kg at 2.5 mm: CBR = (137 ÷ 1370) × 100 = 10%.
Do the cbr test calculation at both penetrations. Normally the 2.5 mm value is higher and is reported. If the 5.0 mm value comes out higher, repeat the test — and if it repeats, the 5.0 mm value is then taken instead.
Reading the result for pavement design
A single cbr value places the subgrade on a design scale. This is the interpretation most engineers work from:
CBR value (%) | Subgrade rating | Typical use |
0 – 3 | Very poor subgrade | Replace or stabilise |
3 – 7 | Poor to fair subgrade | Thicker pavement / capping layer |
7 – 20 | Fair to good subgrade | Usable for most roads |
20 – 50 | Good sub-base | GSB / WMM material |
50 + | Excellent base | High-quality granular base |
A cbr test calculation is only useful once it drives a design decision. That number enters IRC 37, the
flexible pavement design code from the Indian Roads Congress, which converts the CBR and the projected traffic into a total pavement thickness. Highway projects follow the Ministry of Road Transport and Highways specifications, where the design CBR is usually the average of several soaked samples, not a single best result. For granular sub-base assessment, the GSB design mix testing takes over from subgrade CBR.
Enquire Now